



These monthly market commentaries share a synopsis of the U.S. financial markets with intelligent insights.
Latest Commentary:
September 2026 Market Recap
Dear Valued Investor,
As summer winds down and September begins, investors are navigating a market shaped by strong corporate profits, debates about the promise of artificial intelligence (AI), evolving monetary policy expectations, and ongoing geopolitical conflicts. While volatility has increased at times, the backdrop for investors remains fundamentally well supported.
US Economic and Market Outlook
Here are observations on what occurred across the investment markets in August:
Broad Market Performance1
| Index | Aug | YTD | 1 Year | 3 Year |
| S&P 500 | 2.7 | 13.1 | 20.4 | 21.0 |
| MSCI EAFE | 2.0 | 13.8 | 21.6 | 18.3 |
| Bloomberg US Aggregate Bond | 0.4 | -0.3 | 1.9 | 4.1 |
Data as of August 31, 2026
Domestic Equity2
International and Global Equities3
Fixed Income Markets4
Specialty Markets5
Sectors6
US Recession Indicators: All Steam Ahead!
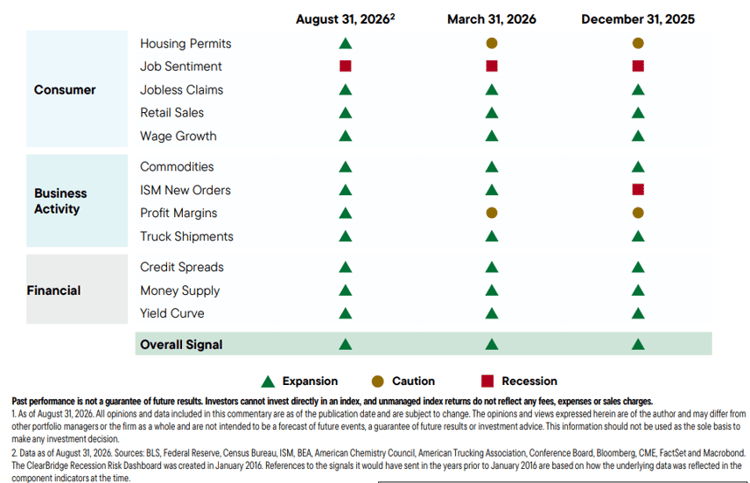
One of the most important pillars supporting the backdrop for the stock market has been corporate profits. Second quarter earnings growth for the S&P 500 is tracking to a stellar 31% excluding mark-ups of investment holdings, while analysts continue to raise forecasts for the second half and 2027. Solid earnings growth across a broad range of sectors has strengthened the fundamental case for stocks. If not for large non-recurring charges by two healthcare companies, all 11 S&P sectors would have grown earnings by 9% or more in the quarter.
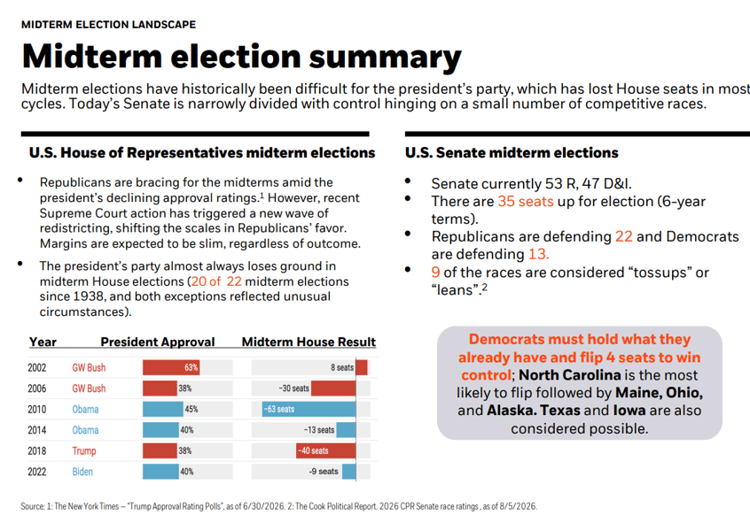
Investors ask about Midterm Elections, so here’s an update:
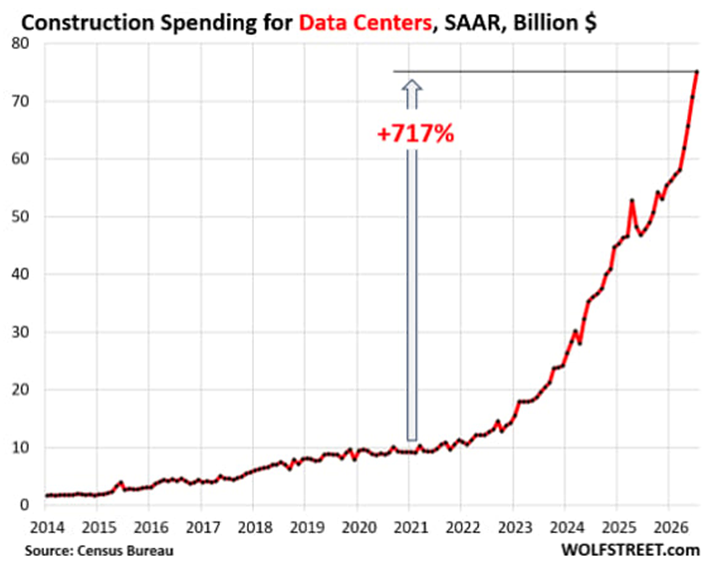
At the same time, investor attention has remained squarely on AI. Recent results and commentary from major technology companies have reinforced their confidence that AI investment will drive innovation and profitable growth, even as market participants debate potential payoffs. Strong outlooks from leading technology companies, including the world’s largest company NVIDIA and some software firms perceived as vulnerable to disruption, have helped maintain investor enthusiasm and put a floor under most AI stocks. However, spending has been increasing every quarter. See below.
Overall, we remain constructive on the stock market outlook, supported by robust and broadening corporate profit trends, a resilient U.S. economy, and continued AI innovation. As appropriate, investors may want to consider above-target weightings in stocks relative to bonds, while considering an allocation to diversifying alternative investments to help mitigate potential volatility as midterm elections approach and monetary policy and geopolitical uncertainty remain elevated. Also consider stocks have historically lagged in September and early October, though less so after a strong eight months.
For fixed income investors, with inflation still sticky and rising odds of a Federal Reserve rate hike, we continue to emphasize high-quality bonds while limiting interest rate sensitivity. Municipal bonds may offer compelling income potential and provide diversification with yields elevated relative to recent history.
In sum, while higher interest rates, ongoing geopolitical conflicts, and midterm election-related policy uncertainty may create short-term market swings, maintaining a disciplined, diversified investment approach remains the most effective way to navigate a dynamic market environment. We will continue to monitor market fluctuations to take advantage of potential opportunities that may emerge after Labor Day.


Helpful Resources:
View our Economic Market Minutes: https://www.gocgo.com/market-minute
Financial Planning Webinars: https://www.gocgo.com/financial-resource-library
Firm Website: https://www.gocgo.com/financial-planning-and-wealth-management
Investor Blog: https://www.commonfinancialsense.com/
Previous Commentary:
Disclosures and references:
Investment Advisory Services offered through Global Retirement Partners, LLC DBA Connor & Gallagher OneSource, an SEC registered investment advisor.
1-6 All data referenced in the table and comments supplied by Morningstar.
This document is a general communication being provided for informational purposes only. It is educational in nature and not designed to be taken as advice or a recommendation for any specific investment product, strategy, plan feature or other purpose in any jurisdiction, nor is it a commitment from Global Retirement Partners, LLC or any of its subsidiaries to participate in any of the transactions mentioned herein. Any examples used are generic, hypothetical and for illustration purposes only. This material does not contain sufficient information to support an investment decision, and it should not be relied upon by you in evaluating the merits of investing in any securities or products. In addition, users should make an independent assessment of the legal, regulatory, tax, credit, and accounting implications and determine, together with their own financial professionals, if any investment mentioned herein is believed to be appropriate to their personal goals. Investors should ensure that they obtain all available relevant information before making any investment. Any forecasts, figures, opinions or investment techniques and strategies set out are for informational purposes only, based on certain assumptions and current market conditions and are subject to change without prior notice. All information presented herein is considered to be accurate at the time of production, but no warranty of accuracy is given and no liability in respect of any error or omission is accepted. It should be noted that investment involves risks, the value of investments and the income from them may fluctuate in accordance with market conditions and taxation agreements and investors may not get back the full amount invested. Both past performance and yields are not reliable indicators of current and future results.
This material is for general information only and is not intended to provide specific advice or recommendations for any individual. There is no assurance that the views or strategies discussed are suitable for all investors or will yield positive outcomes. Investing involves risks including possible loss of principal. Any economic forecasts set forth may not develop as predicted and are subject to change. References to markets, asset classes, and sectors are generally regarding the corresponding market index. Indexes are unmanaged statistical composites and cannot be invested into directly. Index performance is not indicative of the performance of any investment and do not reflect fees, expenses, or sales charges. All performance referenced is historical and is no guarantee of future results. Any company names noted herein are for educational purposes only and not an indication of trading intent or a solicitation of their products or services. Connor & Gallagher OneSource doesn’t provide research on individual equities. All information is believed to be from reliable sources; however Connor & Gallagher OneSource makes no representation as to its completeness or accuracy.
*Securities offered through LPL Financial, Member FINRA & SIPC. Investment advisory services offered through Global Retirement Partners, LLC DBA Connor & Gallagher OneSource, an SEC registered investment advisor. Connor & Gallagher OneSource and Connor & Gallagher Benefit Services are separate entities from LPL Financial.
#1168174 (Exp. 09/2027)
Alphabet (Google), Amazon, Apple, Meta Platforms (Facebook), Microsoft, Nvidia and Tesla.